Wednesday, May 22, 2013

Unlabeled Object Recognition in Google+

Google+ released an amazing feature that uses object recognition to tag photos. Here is a Reddit thread discussing it. Generalized object recognition is an incredibly difficult problem - this is the first product that I have seen which supports it. This isn't a gimmick - it can recognize objects in pictures without *any* corresponding text information (such as in the filename, title, comments, etc). Here are some examples on my photos (none of these photos contain any corresponding text data to help):


At first I thought this last one was a misclassification, until I zoomed in further and saw a tiny plane:


Of course, there are also many misclassifications since this is such a hard problem:

This squirrel came up for [cat]:

This train came up for [car]:

This goat came up for [dog]:

These fireworks came up for [flower]:

This millipede came up for [snake]:

Sunday, May 19, 2013

PAQclass

I have released an open source classification algorithm called PAQclass: https://code.google.com/p/paqclass/. I originally created PAQclass when I was working on my master's thesis but I never got around to releasing it until now. PAQclass does classification via data compression. It uses one of the best compression programs available: PAQ8. Although it is very slow, I think PAQclass is probably close to state of the art for text categorization tasks.

Friday, May 17, 2013

Fathauer Fractal Tessellation


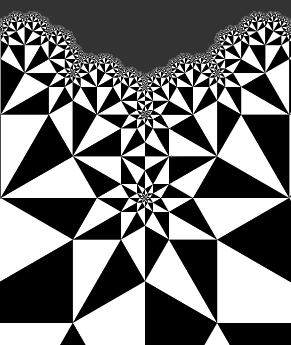
I have implemented a fractal in HTML5 canvas: http://www.byronknoll.com/kites.html. It is based on a fractal discovered by Robert Fathauer. Here is a zoomed-in view of the top of my fractal:


The fractal seems to have some interesting properties. Near the center of the zoomed-in image above you can see a "tunnel" of consecutively smaller triangles. There are an infinite number of these tunnels (and I think they exist in every direction). Along the vertical you can see there is pattern to the location of the tunnels. The distance between the tunnels is a geometric sequence with a common ratio of 1/3. As you travel into a tunnel, the hypotenuse length of consecutive triangles is also a geometric sequence with the same common ratio of 1/3.

Friday, May 10, 2013

O(n log n)

I have released a new version of my visibility polygon library. I improved the time complexity from O(n^2) to O(n log n) (where n is the number of vertices). O(n log n) is actually the *optimal* time complexity for this problem (since this problem can be reduced to sorting, and we know sorting is O(n log n)).

A high level description of the algorithm: First, sort all vertices according to their angle to the observer. Now iterate (angle sweep) through the sorted vertices. For each vertex imagine a ray projecting outwards from the observer towards that vertex - all we need to compute is the closest "active" line segment in order to construct the visibility polygon. The closest active line segment must be computed in O(log n) time (for each vertex). I used a special type of heap to accomplish this. The heap keeps track of all active line segments (arranged by distance to the observer). The closest line segment is at the root of the heap. Since line segments don't intersect (a constraint in the problem definition), the heap remains consistent. This property is essential - if the distance ordering between two line segments could change depending on the angle, then a heap would no longer work. So, we can find the closest segment in O(1) time and insert new segments in O(log n) time. The reason the heap I used is "special" is because it also allows removing line segments (when they are no longer active) in O(log n) time. Inactive line segments can't just be ignored and left in the heap - they need to be removed to maintain a consistent distance ordering. In a standard heap, removing an arbitrary element takes O(n) time (since it takes linear time just to find the element). My heap contains an additional map structure from element value to heap index, so elements can be found in O(1) time. Once an element is found, we swap in the last element in the tree and propagate it either up or down (which takes O(log n) time) to maintain heap correctness. Hooray!

Wednesday, May 01, 2013

Visibility Polygons


I have released an open source JavaScript library for computing visibility polygons: https://code.google.com/p/visibility-polygon-js/

Demo: http://www.byronknoll.com/visibility.html

I don't think there are any other JavaScript libraries which compute visibility polygons. A few years ago I released a Java game that used visibility polygons.

Thursday, April 25, 2013

Google Bikes


An article about Google Bikes is currently on the homepage of wired.com. If you watch the video about conference bikes, I am one of the riders (facing backwards).

Saturday, April 20, 2013

Canvas Demo

http://www.byronknoll.com/geb.html

I didn't use webgl for this demo - just canvas polygons. This is actually the first time I have made a 3D rendering engine. For the simple model in this demo the framerate appears to be high (even on my phone).

Sunday, April 14, 2013

3D Prints

Here are some more 3D prints I ordered from Shapeways:


So, the second version of my monostatic body actually works! You can order the design from Shapeways.

Saturday, March 30, 2013

Monostatic Body

I received the 3D print of the one-sided die that I designed. Unfortunately it sometimes gets stuck upside-down on the unstable equilibrium. I have designed a new version which I think should fix the problem: http://www.shapeways.com/model/979729/monostatic-body.html. This version has a ridge on top which should make the unstable equilibrium... less stable:


The ridge causes the center of mass to raise a bit (to 0.9mm below the cylinder's center). I feel confident that this version of the shape should work - it will take about two weeks until I get the printed copy from Shapeways.

Sunday, March 17, 2013

One-sided die


Today I designed a one-sided die: http://www.shapeways.com/model/979729/one-sided-die.html

I have ordered a 3D print of the model.

A sphere does not make a very good one-sided die because it takes a long time to stabilize after rolling. The shape I designed has some interesting properties. It has only one stable equilibrium, so it will always rest in the same position on a flat surface. It is also homogeneous and convex. A gömböc is another shape with these properties. Unlike a gömböc, my shape has multiple unstable equilibrium points.

My shape is similar to a monostatic polytope described in 1969 by J.H. Conway, M. Goldberg and R.K. Guy. Here is a video demonstrating their shape:


Unlike Conway's shape, my design is smooth everywhere except a flat surface on the bottom. I added the flat surface to help it stabilize faster. It is actually very easy to construct my shape - it is the intersection of a sphere with a cylinder (ignoring the flat bottom). For the design I uploaded to Shapeways, the cylinder has a radius of 10mm and the sphere has a radius of 30mm. It was modeled using Rhino:


The highlighted point in the screenshot is the center of mass - it is 1.059mm below the cylinder's center. I am hoping that the center of mass is low enough so that the actual physical object always reaches the same resting point. Theoretically any center of mass below the cyclinder's center would work, but in practice inaccuracies in the 3D printing process could cause problems.

Friday, March 15, 2013

Gyroid


I ordered a 3D print of a gyroid from Shapeways. The material is alumide. I am very impressed with the quality of the print - I plan to create some of my own models soon.

Wednesday, March 13, 2013

RIP Google Reader


Google has announced that they are shutting down Google Reader. This is a sad day.

Wednesday, February 20, 2013

Rocket Launch

This weekend I launched a low-powered rocket at NASA Ames. The event was organized by the local rocketry club. My rocket was designed by my older brother. Here are some pictures:


NASA is definitely the coolest venue imaginable for launching rockets :). I am guessing there were 50-100 people at the event, with about one rocket launching every minute. One rocket actually fell on me while I was setting up my rocket. Its parachute didn't deploy due to a malfunction. Luckily its terminal velocity was not very fast, so it didn't hurt me. Here is a video of my first launch:

We determined that fire/ember from the engine traveled up the body of the rocket, burning the parachute and snapping the rubber cable which connects the two rocket segments. So the bottom rocket segment crashed without any parachute, causing the four fins to break off. After repairing the rocket with super glue we made a second launch attempt. The second launch was slightly better, but the parachute got tangled and did not fully deploy.

Sunday, February 10, 2013

Blob Balance

I have created a simple game based on the blob demo I made yesterday: http://www.byronknoll.com/balance.html

The blob will become harder to control as your score increases (caused by changes to a "fluidity" parameter).

Saturday, February 09, 2013

HTML5 Blob

Today I made a blob in HTML5 canvas: http://www.byronknoll.com/blob.html

You can interact with the demo by moving your cursor. This is the second time I have made a blob. My first blob was for a game I made called Time Stop. Since Box2D has a JavaScript port, I was planning to use Box2D for this project (here is a Box2D demo in HTML5 canvas).

However, I decided not to use Box2D when I stumbled across this amazing demo: http://www.ewjordan.com/processing/VolumeBlob/. ewjordan discovered a technique for simulating blob physics that is computationally efficient (much faster than Box2D), realistic, and extremely simple to implement. My demo is basically just a port of ewjordan's Processing code to JavaScript.

Saturday, February 02, 2013

Smooth Voronoi Diagrams

The paper.js project has a cool demo with polygon smoothing on a Voronoi diagram. For fun I decided to implement my own version from scratch.
The first step was to implement a system for polygon smoothing using Bézier splines. Here is a demo of the technique (you can click/drag to interact with the demo). The blue points are the original polygon vertices. For the Bézier spline, the midpoints become the vertices and the original vertices become the control points (making this a quadratic Bézier spline).

To compute the Voronoi diagram polygons I used this excellent JavaScript library. Next, I computed polygon centroids using this formula. To create the gap between polygons I scaled the vertices towards each centroid. Here is the final demo: http://www.byronknoll.com/cells.html. The blue dots are the Voronoi seeds and the green dots are the polygon centroids. You can click to create new Voronoi seeds (or drag to move seeds).

I am not completely happy with the demo since there are some "jumps" in the animation when new vertices are added to a polygon. I tried several ideas to make the polygon smoothing more robust to adding vertices, but couldn't find anything I was happy with. Imagine adding a new polygon vertex exactly on top of an existing one. It doesn't change the shape of the original polygon, but it significantly changes the shape of the smoothed version using my algorithm. Intuitively it seems like something that would be easy to overcome, but I haven't been able to figure it out.

Thursday, January 24, 2013

Response

In response to my last post, Jackie asks:
Not sure I understand your point about selling in as short a time window as possible. The day-to-day fluctuations of a stock's price is greater than its fluctuation over a week or so, right? But it might not be worth the extra transaction costs to sell over a time window.
I am replying here so the response is more widely visible. I claim that a stock should have much greater fluctuation at the end of a week than a day. In order to have less variance after a week, the stock would have to revert towards some sort of mean after the daily fluctuation. If this was true, I could use a simple strategy to make huge amounts of money in a short amount of time. I would look at a rolling average of one day for all stocks on the market. I would then buy the lowest stocks relative to their mean and then sell when their price hits the mean. The reason this strategy won't work is because stocks will not revert to a mean in the short-term. The reason they don't revert to a mean is because other investors in the market (especially high-frequency traders) would pick up on such an obvious pattern and take advantage of it. These traders would have a smoothing effect on stock price, ensuring that the price never reverts from the mean. Therefore I think it is necessary that variance increases the further into the future you consider.

Wednesday, January 23, 2013

Optimal Investment Strategies

I have recently become interested in the topic of investment. More specifically, I want to know:
  1. When should I sell my Google stock? Should I sell it all in one chunk or spread out the sales over a time window?
  2. How should I invest money that I currently have sitting in a bank?
I have been reading The Four Pillars of Investment for advice (as recommended by this post).

I was surprised to learn that there are actually provably optimal strategies when making these investment decisions. If you had asked me about this a month ago, I would have shrugged and said that it would be too complex to calculate an optimal strategy and that different experts in the field would probably give different answers. However, now I can say:
If you currently own stock in a single company (or a small set of companies), the optimal strategy is to sell immediately. The sale should be made as a single lump sum instead of spread out over a time window. You should then consider investing that money in an index fund.
The goal of investing money is to maximize expected profit for a given level of risk. The function of expected profit vs risk is monotonically increasing: with more risk you can always find an investment with higher expected profit. This fact can be used to make optimal investment decisions. If one investment has lower risk and higher expected reward than another investment, the optimal choice is clear. So, how can you calculate risk and reward?

It turns out that when investing in stocks, there is one fact that makes computing risk and expected reward much easier: regardless of how smart you are, you can not predict what a stock will do in the immediate future. You have zero information that is not already reflected in the stock price of a company. A company's stock price is a weighted average of a large number of expert investors. As with ensemble methods in machine learning, an individual can not compete with a weighted average of many expert predictors. Any investor who claims to be good at actively choosing a small set of stocks to invest in is wrong - even if they have an incredibly profitable investment history. In a room full of monkeys choosing to invest in random stocks, some of those monkeys would become rich due to natural variance in the profit distribution. I find this fact comforting - I am as good at predicting stock values as the best wall street investors (i.e. I can't).

There are certain exceptions to this:
  • When new public information is released, you can try racing other investors to take advantage of the information (i.e. high-frequency trading) using an algorithm.
  • In the long term, you know that the stock market as a whole will tend to revert to a mean value. It is profitable to invest more heavily during a bear market and sell during a bull market. Reverting to a mean does not apply to individual stocks in the short-term (otherwise it would be very easy to make money in the stock market).
  • In the very long term, you know that all stocks eventually go to zero (i.e. all companies eventually go bankrupt).
It is known that different classes of stock have different levels of risk. A company on the brink of bankruptcy has high risk. As expected, riskier stocks tend to have higher expected profit (this can be verified by analyzing historical data, as done in The Four Pillars). So, let's assume you are interested in investing in a particular "class" of stocks (i.e. a set risk level). Within this class, you do not have the ability to pick out good stocks - the expected profit of all these stocks is the same. So, should you invest in a small set of stocks or a large set? Well, given a set expected profit, you should try to minimize risk. You can do this by decreasing the variance of your investment - splitting your investment among many companies has a lower profit variance than investing in few. So, the optimal strategy here is always to invest in a large number of companies (i.e. index funds).

So, back to my problem of selling stock in a single company. The optimal decision is to sell immediately since I can get the same expected profit with lower risk using an index fund. Now the question of whether to sell in a lump sum or to sell over a time window. Once again, the expected profit of these options is roughly the same since I can't predict what the stock will do in the future. Which option has lower risk? I conducted a poll among some friends and most of them argued that spreading the sale over a time window has lower risk since it will smooth out fluctuations in the stock price. However, I argue that a lump sum payment has much lower risk. The "fluctuations" in a stock price are not centered about some short-term mean - if they were it would be easy to take advantage of this to predict stock price. Instead, the longer your time window, the more variance there is in the expected stock price distribution (which has an expected value equal to the current stock price). This means the longer your time window, the more risk you incur. Therefore the optimal strategy is to minimize the time window (i.e. make a single lump-sum payment).

Now on to my second question of what to do with money in a bank. Even if I am completely risk averse, there exist investments with a higher expected value and lower risk than storing money in an account without interest rate. Due to inflation, I think most bank accounts actually have a negative expected value. As for my level of risk-aversion, I will probably work on constructing a portfolio with a mix of different classes of index funds and bonds. Once I have constructed a portfolio, the only maintenance it needs over time is rebalancing.

So, does anything here sound controversial to you? If so, please let me know - I am still new to this and could be completely wrong. But as far as I can tell, I can compute the optimal investment strategy when comparing a small set of options.